Covid-19 Forecasting
By late March 2020 it was becoming clear that many of the proliferating models being used to forecast Covid-19 cases were not performing well. Some models were based on overly simplistic logistic curve fits, and some assumed that the number of positive test results corresponded closely to the true number of cases, which was far from the truth in most countries but especially so in the United States. So we set ourselves the ambitious task of trying to do better, and are now publishing daily updates of our model.
How does it work?
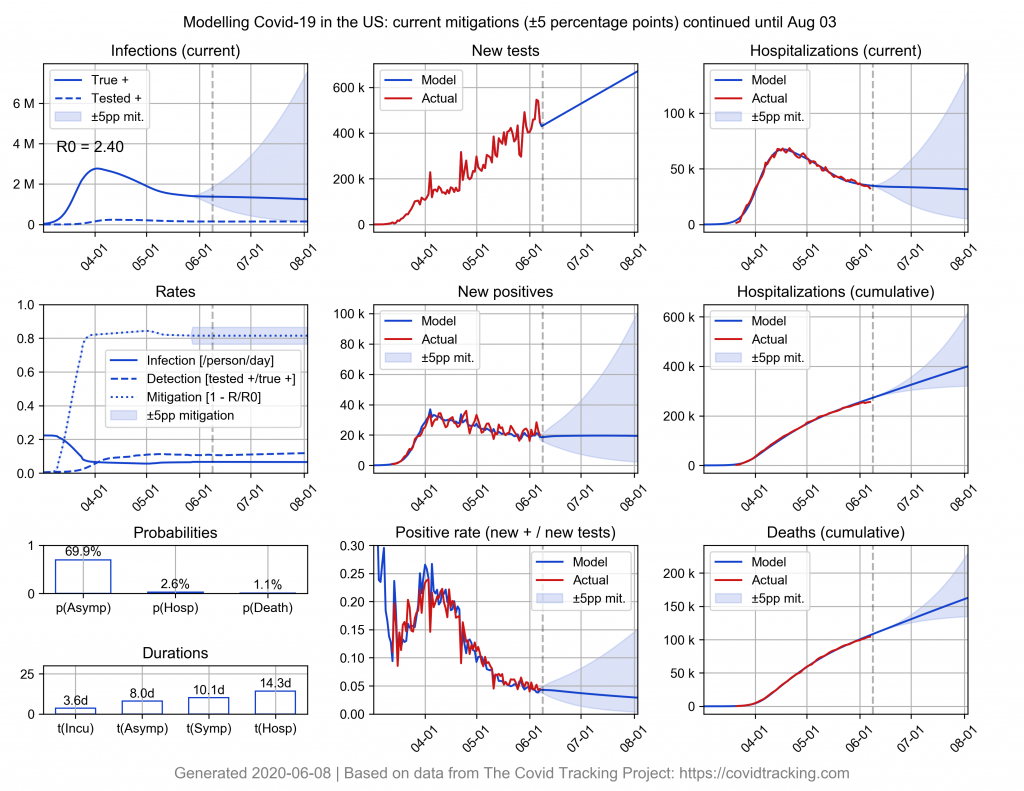
Our Covid-19 model is based on what we call a Modified Markov Chain1We say “modified” because in a traditional Markov Chain the next state depends only on the current state. In our case the “states” are the aggregate status of all infected individuals on a given day, and the next state depends not only on the current state but on an additional external factor: the number of tests performed on a given day. The number of tests performed determines when a simulated “symptomatic untested” individual becomes a “symptomatic positive” individual, which in turns affects that individual’s likelihood of infecting others.. It simulates the various stages of infection (susceptible, asymptomatic, symptomatic, hospitalized, recovered, etc.) and the transitions between these stages. It has around 30 independent parameters, including:
- The initial number of infections
- The probability of transitioning from each stage to another
- The time frame in which such transitions are possible for each stage
- The probability of infecting others in each stage
- The time frame and overall effectiveness of mitigation measures (including social distancing, travel restrictions, increased hand washing, etc.)
With a functioning model, the challenge was then to find parameter values consistent with the observable data, such as hospitalizations and deaths. Because there are so many parameters and so few observables the system is significantly underdetermined, so we began with a global search algorithm (specifically, a differential evolution algorithm) to find the best possible fit out of a potentially large range of possibilities.
After the initial global search had converged on a promising parameter set, a least squares algorithm (with basin hopping) was applied on a daily basis, to continually refine the model as new data became available.
How accurate is it?
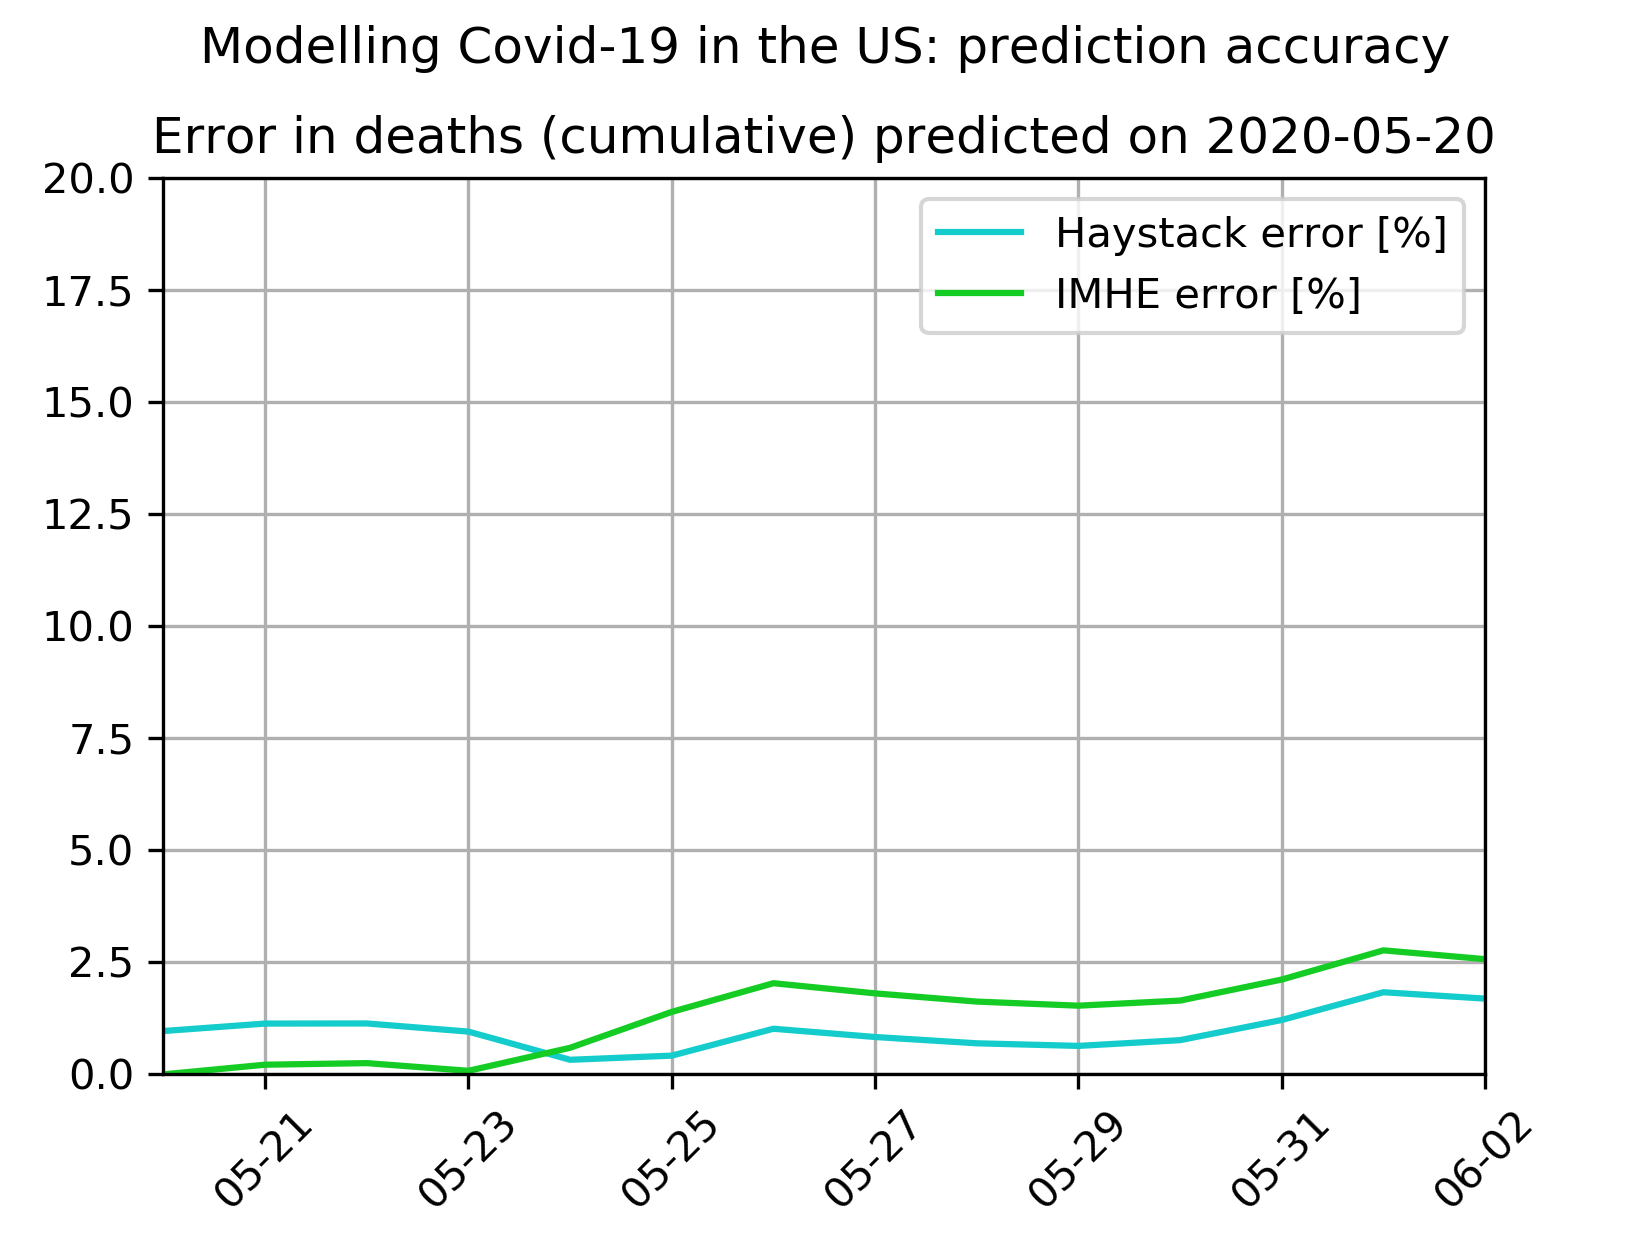
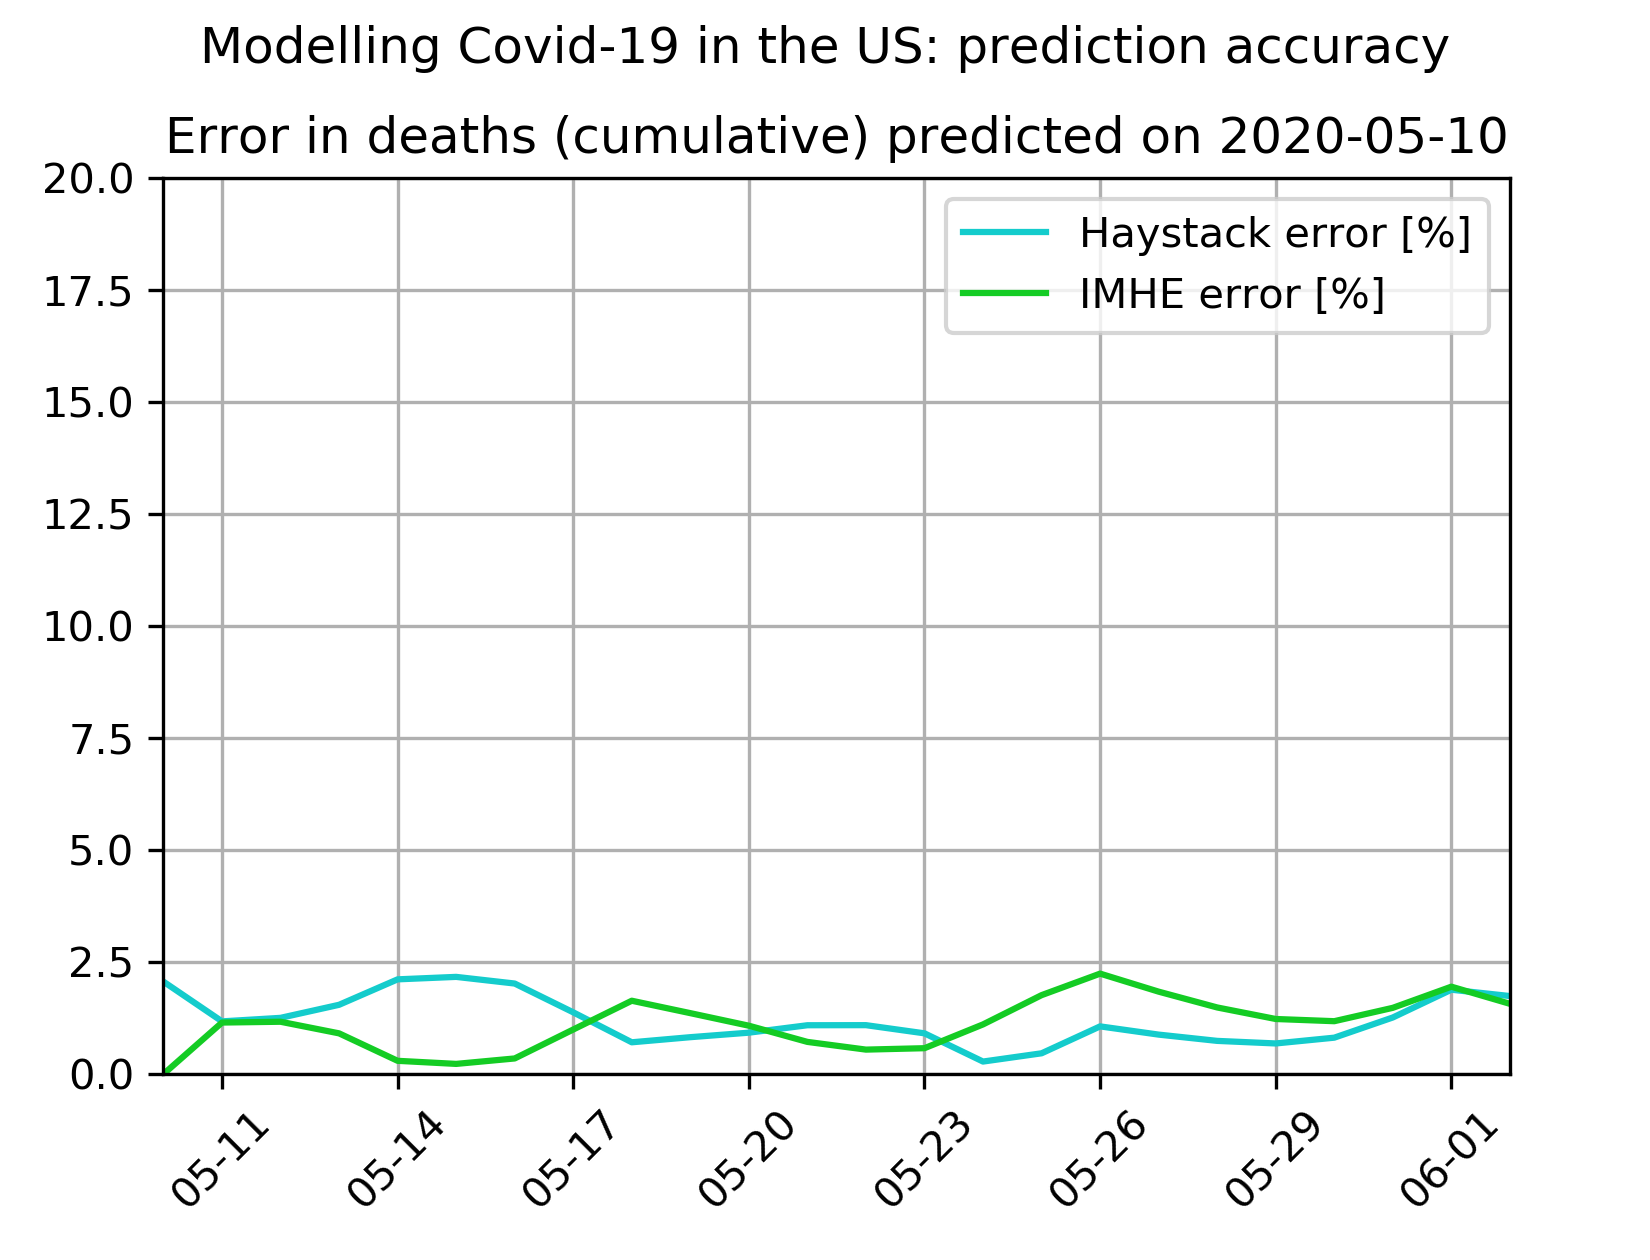
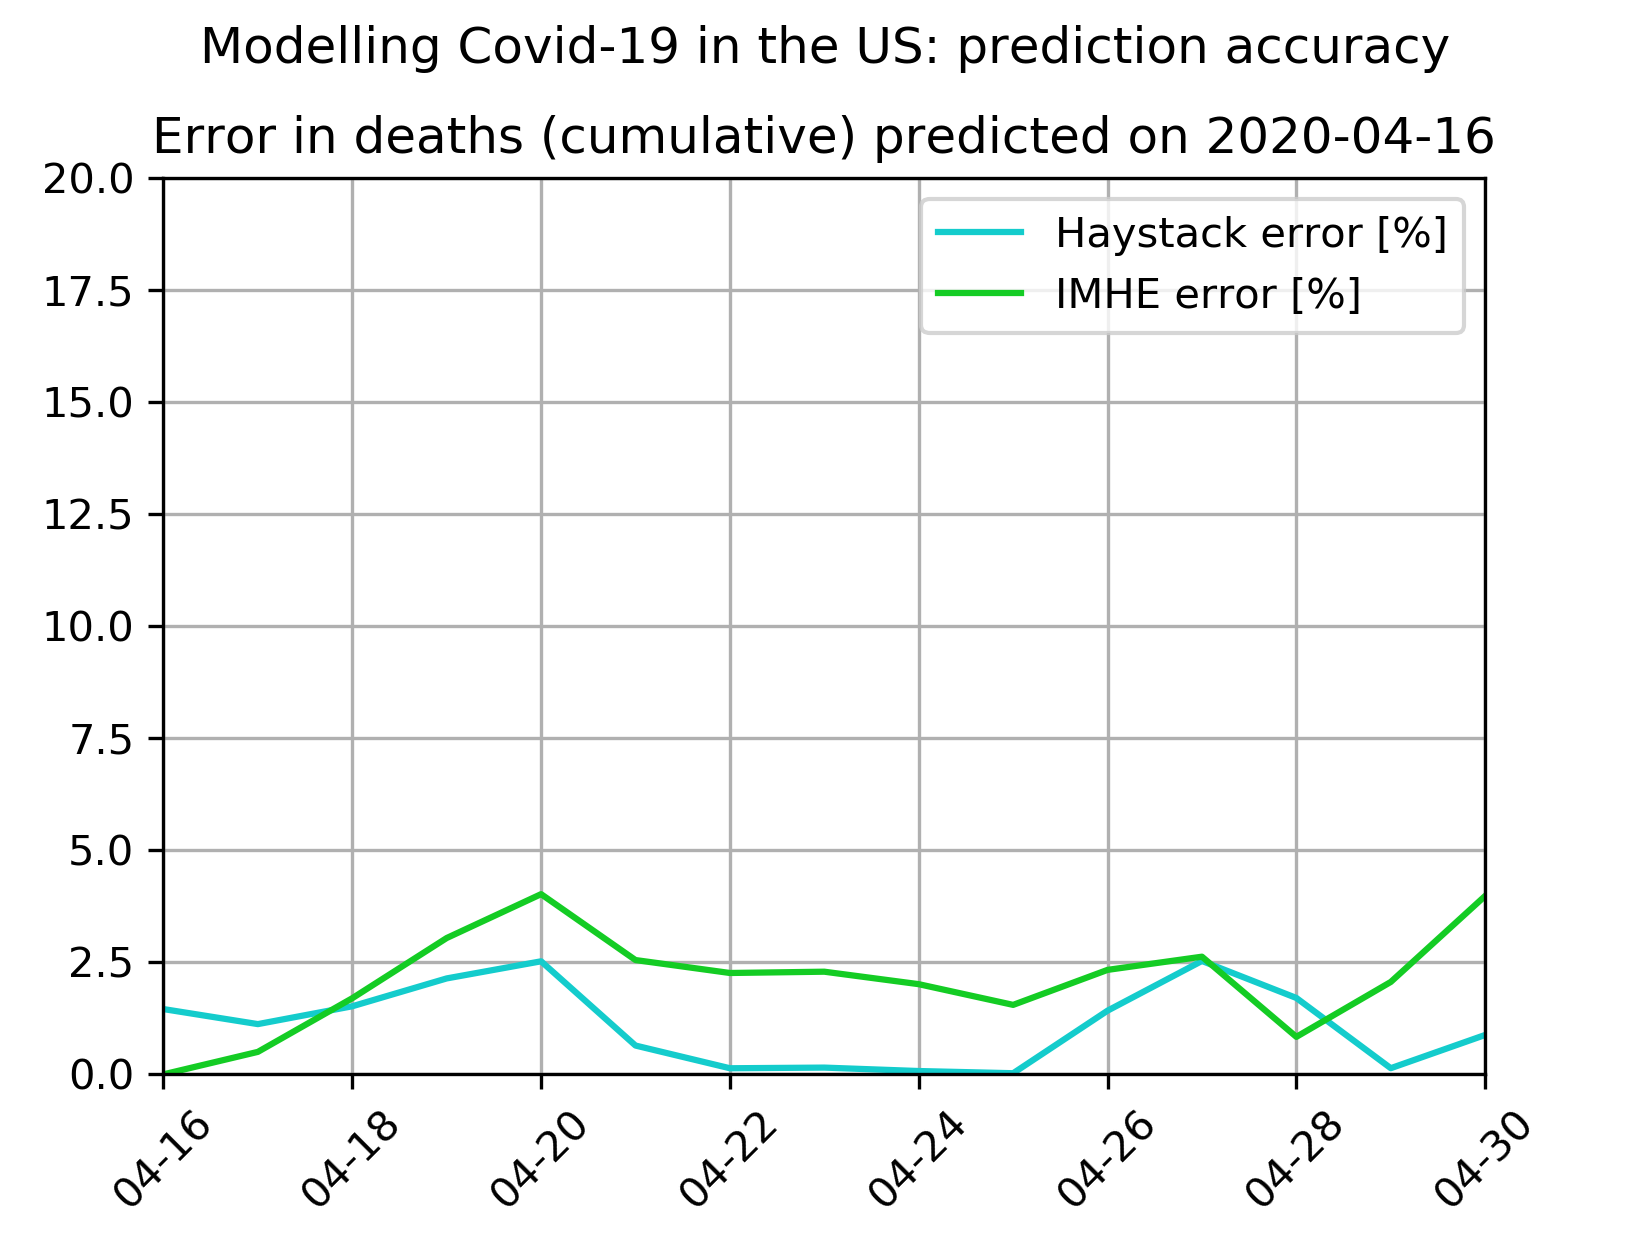
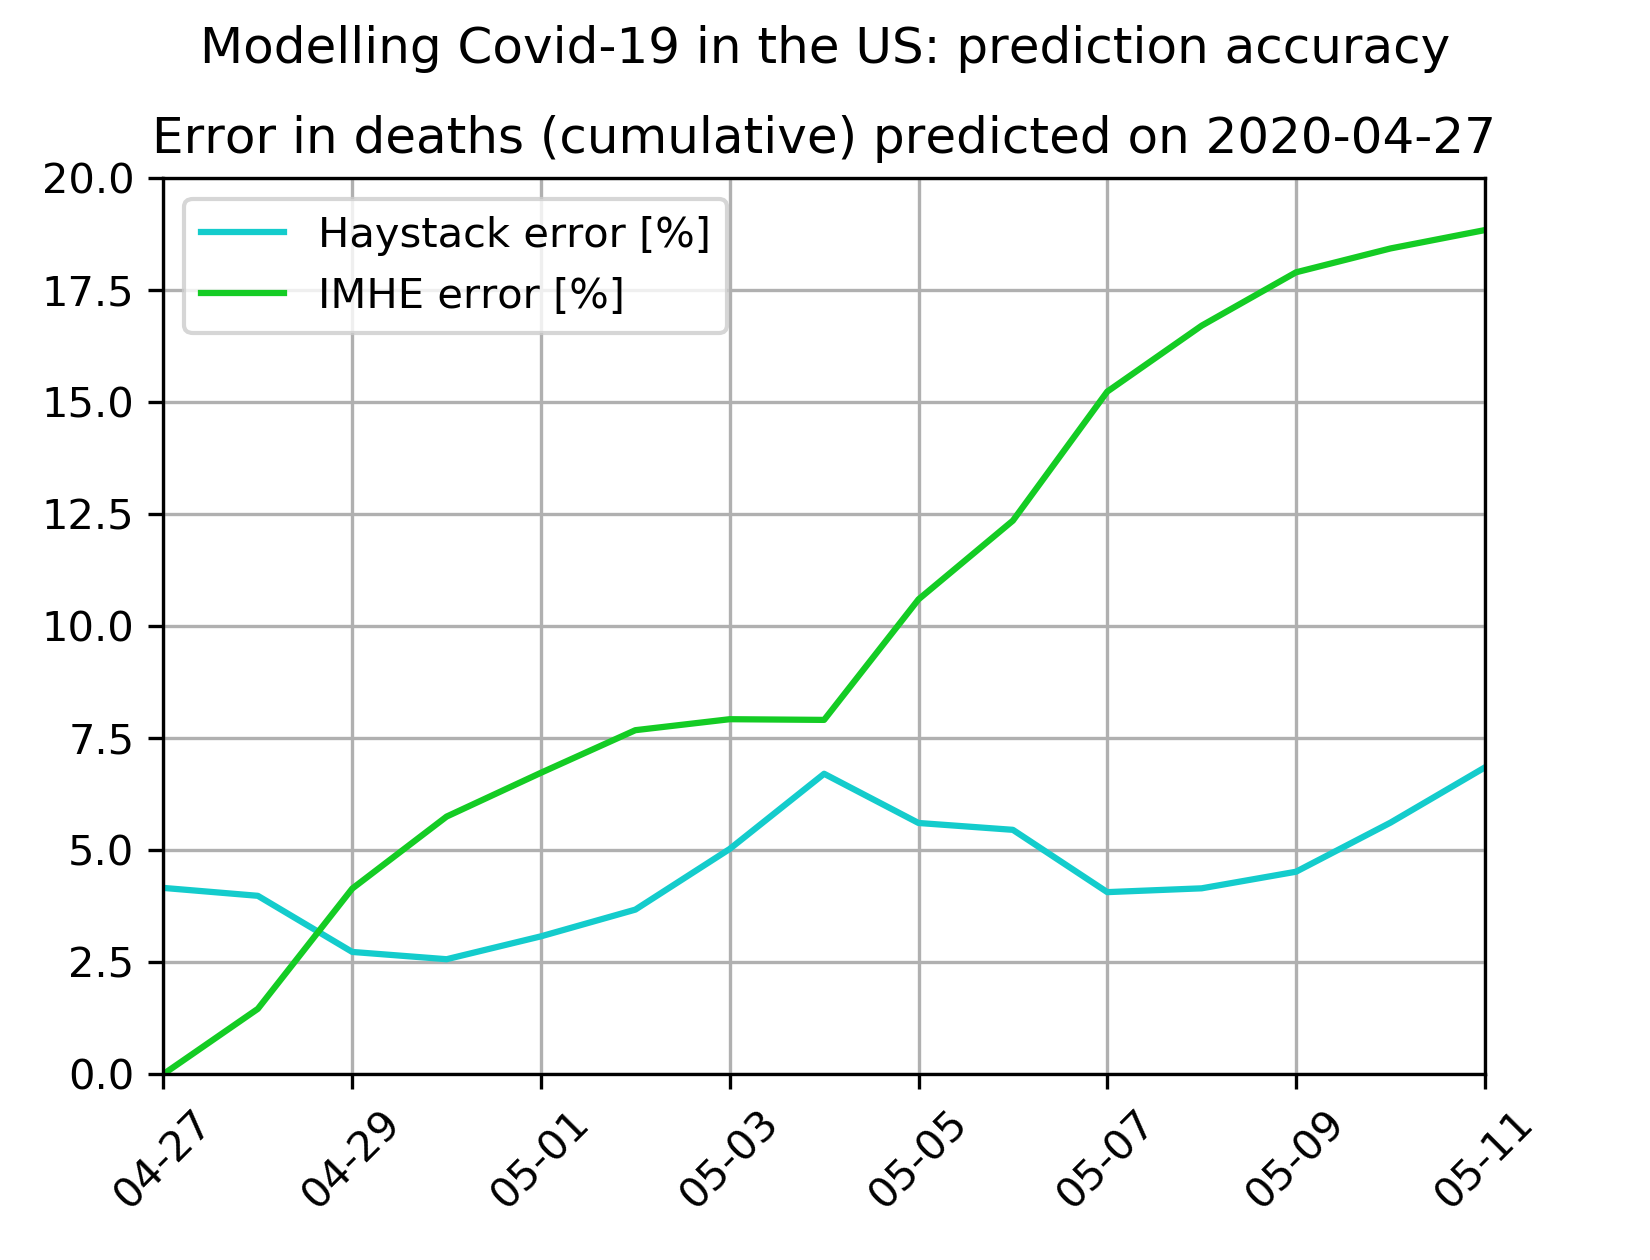
We compared our model’s predictions to those made by the University of Washington’s Institute for Health Metrics (IHME), one of the leading models employed by federal and state decision makers from the outset of the Covid-19 pandemic.
These comparisons show that our two-week predictions have been as good or better than IMHE’s and were, on April 27 in particular, better by a margin of over 10%, at a time when many states were making crucial decisions about when to ease lockdown restrictions.
Future work
One of the ways in which this work could be extended is by breaking down the single overall mitigation parameter into multiple parameters for the various types of mitigations that were put in place. Then, by incorporating data on which mitigations were enacted, revoked, or modified for individual states and provinces, it should be possible to make conclusions about the relative effectiveness of each measure. As the time of writing these conclusions are still sorely needed by governments as they attempt to gradually loosen restrictions and restore economic activity.